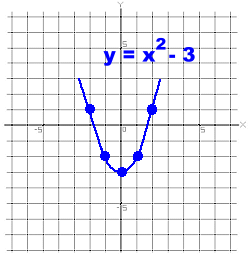
Here is a simple parabola, or quadratic function.
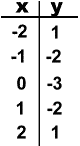
Its equation is y = x2 - 3
There is a portion of this graph that is negative. It looks like everything on the graph from x values of about -1.7 to +1.7
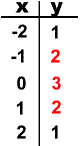
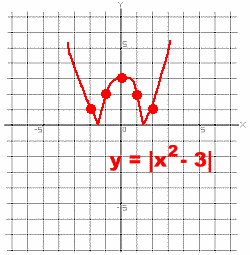
When we apply the absolute value bars to this function, the curved part of the parabola that is below the X axis will reflect upwards. Have a look below.
|
|
|