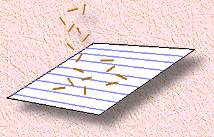
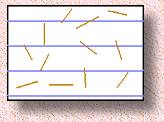
 Imagine dropping a handful of toothpicks onto a sheet of paper that has been ruled with a number of parallel, equidistant lines. What is the probability that any toothpick will land in such a way that it intersects a line? At first glance, this problem seems difficult to solve. We will attempt to work out that probability, and show how you can find the value of PI by recording how many toothpicks actually intersect a line! |
|
Visit our 'Calculating Pi' page, where we outline how to work out the value of Pi using toothpicks, but only if you're willing to do a large number of trials. We did that over the course of about three years, asking for and receiving results from classrooms all around the world. You can see how close we came to the actual value of pi. |
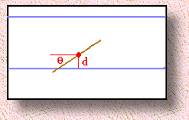
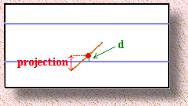
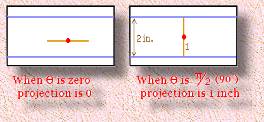
In order to actually calculate the probability that a toothpick will cross a line, let's look at a specific case. We'll make both the distance between the lines, and the length of a toothpick, each exactly 2 inches. (We use non-metric units here to approximate the actual length of a toothpick.) Now, we can plot all the possible toothpick angles (these range from 0 degrees to 90 degrees (
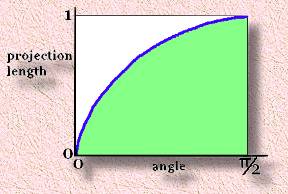 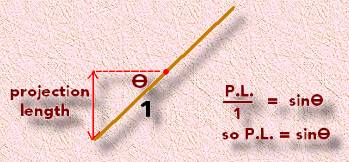 So the y axis of the graph above is just 'sine' ... it's a sine graph. We stated that the toothpick would intersect a line if the projection length was greater than the distance from the center of the toothpick to the line. Or, if the toothpick centre is less than the projection length, the toothpick will cross a line. This can now be reworded as: less than the sine, will cross a line" These toothpicks are represented by the green region on the graph. All toothpicks that fall in this region, under the sine curve, will intersect a line. This means that: 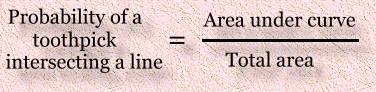 The area under this portion of the sine curve (in green): can be calculated by using the method for finding the area under a curve, called 'integration': 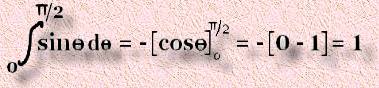 So the area under the sine graph is 1. This means the probability of intersection can be restated as: 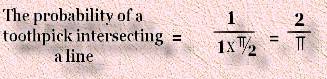 can be used to determine the value of Pi! Let's now generalize these results.
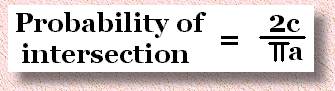 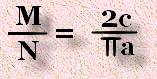 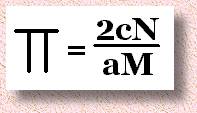 (We leave it to the Math 31 student to redo the calculations using c and a, to show where this formula comes from. Give it a try ... it's not very difficult.) This formula was used to predict a value for PI by a turn-of-the-century Italian mathematician named Lazzarini. He made 3408 trials, and found 2169 intersections. Using the formula, he determined Pi correct to six decimal places:
I have done this experiment several times with Junior High math classes, using as many as 5000 trials; we were lucky to get 3.0! What we then did was to conduct an on-line collection of data from visitors' experiments! Visit our 'Calculating Pi' page, designed for Junior High classes, to see what we did. We've listed some of the data that we received, and we kept a running tally on the value of PI generated. |