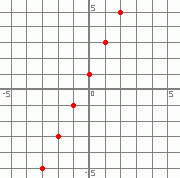
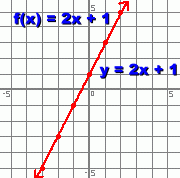
 Functions Visualized Graphically Let's use a simple function as an example: f(x) = 2x + 1 The function given by f(x) = 2x + 1 results in sets of two number pairs: - the number you pick, to fill in - the number that the function changes it into. For example, what is f(3) ? >>> f(3) = 2(3) + 1 = 7 x is the number you fill in. In this case, x is 3 f(3) is the number you get after applying function f. In this case, f(3) is 7. Since every x value results in an answer f(x), we can generate some ordered pairs. We can then locate these values on a set of x-y axes, where y is f(x) First let's find some more values that result from applying this function. We already know that when x is 3, the function gives an answer of 7. This is represented by the ordered pair (3 , 7) We'll pick some more x values: -3, -2, -1, 0, 1, and 2 and find out what function f does to them:
Now let's plot all these ordered pairs on a set of x-y axes:
The full set of points is then a solid line of dots, with arrows at each end. All that's left is to describe in general what the graphs of functions look like. The easiest way to do this is to look at a graph which is not a function. Here's one: 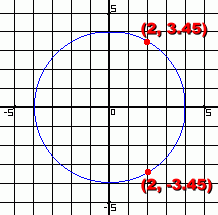
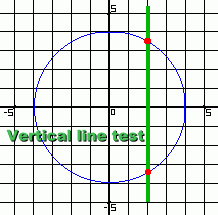
You may remember the definition of a function: 'A function is a mathematical expression which changes one number into another. It always changes a number the same way'. The graph shown here is a circle, and it is not a function. This is because when the value of x is 2, there is more than one different y value. In other words, the fact that the graph has two different points sharing the same x value, but with different y values, ... for example (2, 3.45) and (2, -3.45), ... means that this is not a function. In fact, there are many points with the same x value, but different y values, on a circle.
Now let's look at a set of points which is a function. 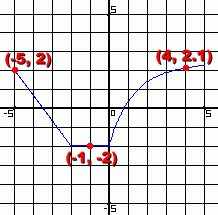
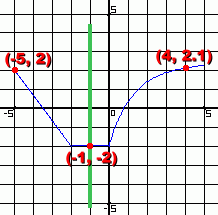 Once again the plotted points form a pattern.
 We've identified some of the points that were used to generate the graph. Every x value here has its own unique y value. Imagine applying the vertical line test. We did it once, at the right. Can you see that it wouldn't matter where we put the vertical line ... it will never touch this set of points more than once. This set of points is a function. Graphically, functions can always be identified using the Vertical Line Test. If a vertical line can never touch more than one point, the set of points is a function. |
