If you're interested in learning about other basic operations on this calculator, visit our TI83+ page Your calculator will graph functions that are in the form "y =". If the function you want to graph is not in this form, you will need to rearrange it first.  The window screen lets you set how big the graph will be. Most graphs you will see in your first Math course using the TI will fit comfortably on a graph whose axes go to 10 in all directions. Pressing the 'window' key brings up the screen visible at the right. The settings you want are shown: The window screen lets you set how big the graph will be. Most graphs you will see in your first Math course using the TI will fit comfortably on a graph whose axes go to 10 in all directions. Pressing the 'window' key brings up the screen visible at the right. The settings you want are shown:- the x-axis settings go from -10 to 10, with dashes every 1 unit. - the y-axis settings go from -10 to 10, with dashes every 1 unit. (Ignore other settings ... you won't need to change them).  Be careful with negative signs.
The TI requires that a negative in front of a number be entered with the (-) key at the bottom of the keyboard. Entering a function:  The y= key at the top left of the keyboard will let you enter the function you want to graph. In fact, you can enter up to 10 different functions at the same time, and see all ten graphs on the same set of axes. We may want to enter more than one function later; for now, we'll just do one at a time.
The function we are going to graph is given by the equation y = x2 - 3. Press the 'y=' key, and enter it as function Y1; you should see Y1 = x^2 - 3. Notice that the TI shows an exponent with the power symbol '^'. You may choose to use the 'x-squared' key on the left instead, in which case you'll see x2 intead of x^2. 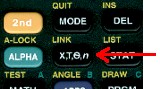
The 'x' key is a black one near the top of the keyboard; it's labelled 'x,T,theta,n'. Use this whenever you want to enter variable x.
With the graph showing, press the yellow '2nd' key and 'graph', to get the table. You will see the table of points shown at the right. It's infinite, so you can scroll up or down, and pick pairs of Press the 'graph' key again, so the graph is visible. Let's find the lowest value on the graph. This is called the minimum value.  One way to do this is to make the calculator show a moveable cursor, which you can use to trace the curve to the point which you want to identify. Press the 'trace' key (next to the 'graph' key). A flashing cursor appears on the screen; you can move it left or right using the arrows until it looks like it's sitting on the minimum value. As you move the cursor, the display tells you (at the bottom) what the current value of x and y are, for the location of the cursor. One way to do this is to make the calculator show a moveable cursor, which you can use to trace the curve to the point which you want to identify. Press the 'trace' key (next to the 'graph' key). A flashing cursor appears on the screen; you can move it left or right using the arrows until it looks like it's sitting on the minimum value. As you move the cursor, the display tells you (at the bottom) what the current value of x and y are, for the location of the cursor.This minimum was pretty obviously (0, -3), but this method will work even for non-obvious values, specifically for non-whole ones. 'Trace' is easy to use, but it's not very accurate. 
Another way to find the minimum is to let the calculator work it out for you. Press the 'graph' key again to see the function without the tracing cursor. Now press the yellow '2nd' key and the 'trace' key, but this time we're going to the 'calc' menu above it. The menu that appears (shown at the right) will let you find out a lot of information about the function you're graphing. You'll learn how to use most of these in your Sr. High math courses. For now we want to choose #3: Minimum. Scroll down to that item and press 'enter'. The flashing cursor appears once again. This time, the calculator will figure out the exact minimum value for you; this is useful when the point is not a whole number and tracing is too inaccurate. First, move the cursor to the left of where the minimum appears to be. You're telling the calculator what the 'left bound' is, or where to start looking, from the left. Press 'enter'. Now it wants to know where to stop looking. Move the cursor to the right of apparent minimum, and give it the right bound by pressing 'enter'. Now it wants a guess at the location. Move the cursor as close to the minimum as you can, and press 'enter' one more time. The calculator will display an accurate pair of numbers for the minimum point. The x-value should be 0, and the y-value should be -3.    (Occasionally the calculator will have difficulty calculating values, and instead of displaying 0, will show a value like 2.0518E-6. This corresponds to the scientific notation value 2.0518 x 10⁻⁶, or 0.0000020518, which is as close to zero as it can get. Just call it zero). Let's go back and try another function. Press the 'y=' key, and then 'clear'. The former function should disappear. This also will clear the graph screen. Enter a new function: y = -2x2 + 8x - 4.5 You should see Y1 = -2x^2 + 8x - 4.5 Make sure that the first negative was entered using the (-) key, while the last one was entered using the 'subtract' key.  Press the 'graph' key and you'll see the function graphed, as at the right. Press the 'graph' key and you'll see the function graphed, as at the right.This function is upside down, as compared to the first example we graphed. We'll find the maximum value. Go to the 'calc' menu and choose 'maximum'. Move the cursor clearly left of the apparent maximum. Press 'enter'. Move the cursor clearly right of the apparent maximum. Press 'enter'. Move the cursor somewhere close to the apparent maximum. Press 'enter'. You should see the coordinates of the maximum point displayed as x = 2 and y = 3.5 (Again, you may see 2.000001 instead of 2. Just assume it's 2). As you learn more about graphing functions in your math classes, you will be shown how to use additional features on the TI to discover more information about individual functions, and combinations of functions. Using the calculator in this way allows us to examine many more functions and their graphs, and learn much more mathematics, than used to be possible when all graphs had to be plotted by hand. |