|
The experimental probability of an event occurring can be calculated by doing many trials, and dividing the number of occurrences of the desired result by the total number of trials. For example, suppose you wanted to discover the probability of rolling a three with one die. You could roll the die 600 times, and end up with 97 threes out of the 600 rolls. This would give you an answer of 97 divided by 600, or about 0.162, or 16.2% Of course, you know that for a perfect die, the theoretical probability of rolling a three is 1 chance in 6, which is 1 divided by 6, or 16.666...% But this is only what is expected to happen. During a real experiment or roll of the die, anything can happen. The result of any single roll is not predictable. In fact, after ten rolls, or twenty, you might not get a three at all! But as the number of trials increases, the experimental result will get closer and closer the the predicted, or theoretical, answer. Our result above of 16.2% was very close to one chance in six. In this case, we might want to know what the sum of the two dice will be. What possibilities are there? The smallest possibility is a one on both, which gives a sum of two. The largest possibility is a six on both, which gives a sum of twelve. All sums between two and twelve are possible. But how many different combinations are there? Look for the sum of the two dice. Roll the pair of dice here. Roll them a few times and add the numbers each time; verify that the sum will always be between 2 and 12. How many rolls did you need before you got a sum of 12? Here are some questions we'd like to answer:
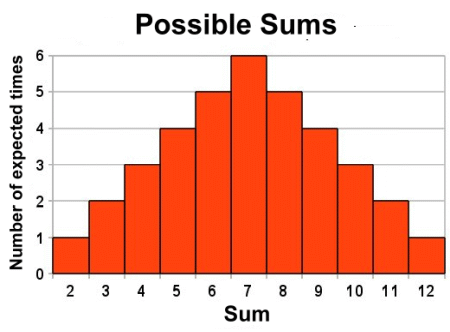
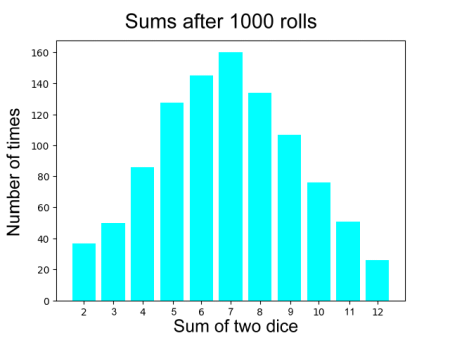
But his will be a lot of work; you'll need to roll the dice at least a thousand times to get a clear idea of how often each sum comes up. So we did the work for you. Before we look at the results, let's go over exactly what's happening: What happens if we roll two dice? We want to know what the sum of the two dice will be. All sums in between two and twelve are possible. How many different combinations are there? Here's a summary of all the possible combinations: 2 - 1 2 - 2 2 - 3 2 - 4 2 - 5 2 - 6 3 - 1 3 - 2 3 - 3 3 - 4 3 - 5 3 - 6 4 - 1 4 - 2 4 - 3 4 - 4 4 - 5 4 - 6 5 - 1 5 - 2 5 - 3 5 - 4 5 - 5 5 - 6 6 - 1 6 - 2 6 - 3 6 - 4 6 - 5 6 - 6 There are 36 different possible combinations of the two dice. Based on this table, which lists all the possible combinations which could theoretically occur, let's look at some theoretical probabilities. A sum of two happens 1 time in thirty six possibilities. Thats 1 out of 36, or 2.8% of the time. A sum of three happens 2 times in thirty six possibilities. Thats 2 out of 36, or 5.6% of the time. A sum of four happens 3 times in thirty six possibilities. Thats 3 out of 36, or 8.3% of the time. A sum of five happens 4 times in thirty six possibilities. Thats 4 out of 36, or 11.1% of the time. A sum of six happens 5 times in thirty six possibilities. Thats 5 out of 36, or 13.9% of the time. A sum of seven happens 6 times in thirty six possibilities. Thats 6 out of 36, or 16.7% of the time. A sum of eight happens 5 times in thirty six possibilities. Thats 5 out of 36, or 13.9% of the time. A sum of nine happens 4 times in thirty six possibilities. Thats 4 out of 36, or 11.1% of the time. A sum of ten happens 3 times in thirty six possibilities. Thats 3 out of 36, or 8.3% of the time. A sum of eleven happens 2 times in thirty six possibilities. Thats 2 out of 36, or 5.6% of the time. A sum of twelve happens 1 time in thirty six possibilities. Thats 1 out of 36, or 2.8%% of the time. Here's the result in chart form:  Notice that of the thirty-six possible sums, a sum of seven came up six times. This is more times than any other sum. This represented 16.7% of the possibilities. From examining what could happen, based on the possible sums we could get when rolling two dice, we've calculated the theoretical probability. For example, we now know that the theoretical probability of getting a sum of seven is 6 times out of 36, or 16.7%. sum of seven 16.7% of the time. Specifically, if we roll the dice 1000 times, we should expect to get a sum of seven on 16.7% of the rolls, or 167 times, Let's do the experiment and see if that's true. We rolled the pair of dice 1000 times, and recorded the sums. Then we counted how many times each sum happened in the thousand rolls. Here's the results we got, in graph form:  The first thing that's obvious is that the shape of the graph, while very similar to the theoretical results, is not quite the same. For example, the theoretical expectation for rolling a sum of two was the same as for rolling a twelve, but here in the experiment they're different. Similarly, the number of times that seven was rolled was only about 160, which differs from the expected result of 167. None of the experimental results match the predicted results exactly. Here's what's happening:
 Let's illustrate this with another example: flipping a coin. Let's illustrate this with another example: flipping a coin.There is a 50% chance that a coin will turn up a head. The theoretical probability of getting a head is 50%. That means when you flip a coin ten times, you should get a head five times. But of course that doesn't have to happen. In fact, it probably won't. More likely is something like seven heads and three tails. It's even possible, although not very likely, that you could see ten heads in a row. The point is that experimentally, anything could happen! The more times you flip the coin, counting the number of times you got a head, the closer the number of heads will be to exactly half of the tosses. The experimental probability of getting a head, after 1000 tosses, likely could be something like 492 out of 1000, or 49.2% It's possible that you could see exactly 500 heads and 500 tails. But that would be surprising. It's even possible that all 1000 tosses could have been heads, but that would be highly unlikely. experimental result will approach the theoretical result. |