Graphing a Line
If you are required to graph a line (or any relation), the TI83 can provide a quick way to get the result, and it will even show you what the graph looks like.
|
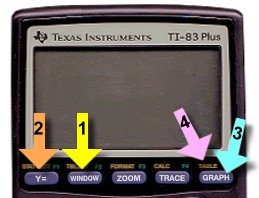
The keys you will need are just below the screen.
- Window: this sets the size of the graph
- Y=: this lets you enter the equation
- Graph: this makes the calculator show the graph
- Table: this shows you the table of points used
Let's look at an actual example.
We'll draw the graph of the line Y = 2X + 3
|
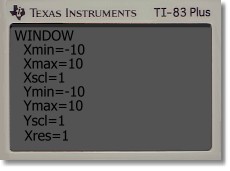
The first step is to set the size of the graph.
Press the 'WINDOW' key (#1 shown above).
You'll see the screen shown at the right.
The numbers illustrate the best dimensions for any line graph you are likely to see in math 9 or 10. They'll give you a graph that extends from -10 to 10 in both directions, with a dash evey 1 unit.
Make the numbers look like what you see at the right; press 'ENTER' after retyping each number.
When done, press the 'Y=' key (#2 shown above).
|
|
|
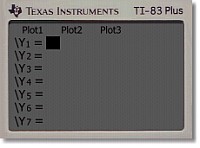
This screen lets you enter the line equation you want to graph.
In fact, the TI83 will let you enter up to 10 equations at once (scroll down to see!) and will graph them all. But you won't be doing that.
We just want to enter one line equation.
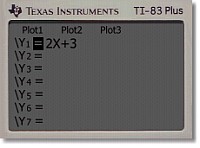
Next to Y1, enter 2X+3 [locate the X key]
Your screen should look like the right.
|
|
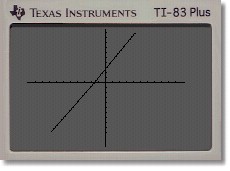
Now press the 'GRAPH' key (#3 above)
The calculator screen will show you the graph of Y=2x+3
There are a lot of things you can do with this graph, but for our purposes, all we want to be able to do now is transfer this to graph paper. We need some of the points that the calculator used to plot the line.
|
|
|
The screen graph isn't very accurate. Fortunately, the calculator can show you exactly what points it used.
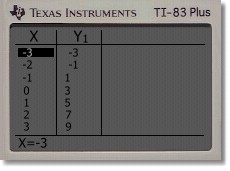
Press the 'TABLE' key (#4 above). It's above the 'GRAPH' key, so you'll have to press the yellow '2nd' key first to access it.
You'll see a table of all the points used to draw the line. In fact, it's an infinite table ... you can scroll up and down to find any points anywhere on the line if it were extended indefinitely.
|
You can copy some of these points to paper, and then plot them on graph paper, to get an accurate graph of the line. The screen graph (press 'GRAPH' again to get back to it) provides a check that your paper graph is correct.
When done, press 'Y=' to clear the old equation, and you'll be ready to start a new one.
MENU
|