
 A topographic map is a special type of map that shows the height of the terrain you are travelling over. This height is called the land's elevation, and a topographic map shows it in a unique way.
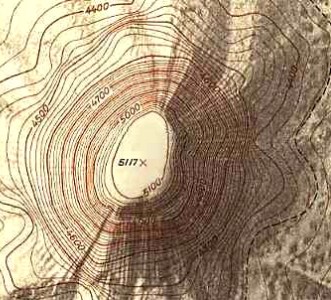
At the right is an actual example of a topographic map, describing a mountain. You can see that regions are marked off with lines that form rough circles. Each line records the elevation
at that level. For example, you can see a line that says '4700'. All along the path of that line the elevation is 4700 feet (above sea level).
As you get closer to the peak of the mountain, the elevation increases past 5000 feet; the top elevation is marked with an 'x' and is 5117 feet.
On this page we'll show you how these maps work, by creating our own topographic map of a small 'mountain'.
|
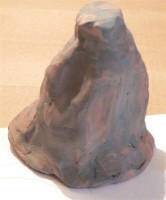
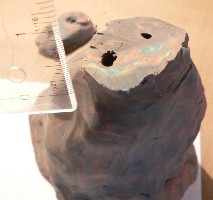
We're going to make a topographic map for a plasticene 'mountain' 9 cm across at the base and 6 cm tall.
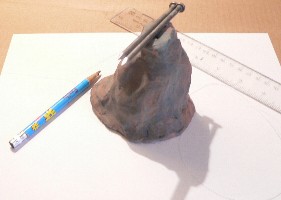
The stuff you'll need is shown at the right: plasticene, paper, pencil, ruler, two nails or stiff wire (longer than the height of the mountain), and a short length of fishing line.
The first step is to make the mountain; be sure to give it both steep and shallow sides, and an oblong cross-section. For simplicity, make it a whole number of centimetres in height.
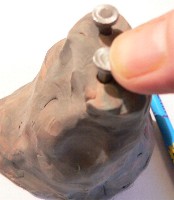 Begin by tracing the outline of the base of the mountain onto the paper. Then press the nails or wire directly down through the mountain so that they make an impression on the paper below. (We put the paper on cardboard to make this easier). The holes and marks will help you line up each slice of the mountain as you trace it.
|
|
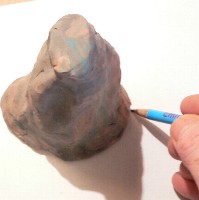
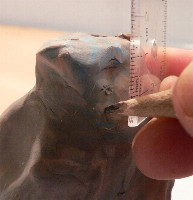 Our map will start with the top elevation. We're going to show elevation changes of 1 cm on the map, so measure 1 cm down from the top of the mountain and make a small mark.
|
 Using the fishing line, carefully cut off the top one centimetre of the mountain, at the mark you made. Be sure to make the cut as close to horizontal as you can.
|
|
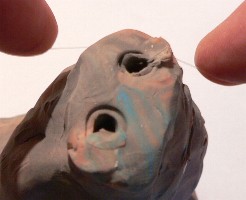
 Take the piece you've cut off and lay it on the paper inside the base line, making sure the holes line up with the marks on the paper from the nails. Trace this shape, and label it '1'.
|
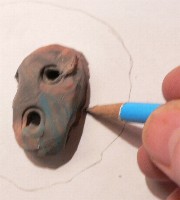
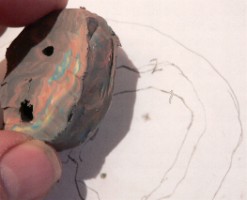 Continue cutting 1 cm off the mountain at a time, and tracing each shape on the map. Remember to line up the holes carefully, and to make sure the cuts are horizontal. Label each traced line '2', '3', etc.
|
You might want to make it easier to distinguish one line from the next by drawing each in a different colour. We didn't do that here.
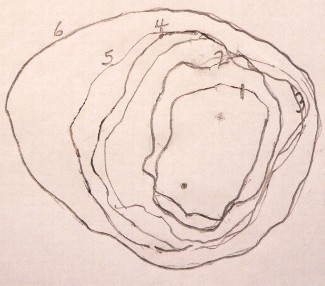
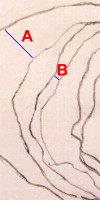
 When you're done, you should have a drawing like the one at the left, above. In order to turn this into a topographic map, we merely need to relabel each of the lines with their elevation, or height above 'ground level'.
The outermost line (#6) is at ground level, so it doesn't get an elevation. The next line (#5) is 1 cm above ground level. The line after that is 2 cm above ground level ... and so on. We relabelled all the lines, and put an 'x' at the top, whose elevation was 6 cm.
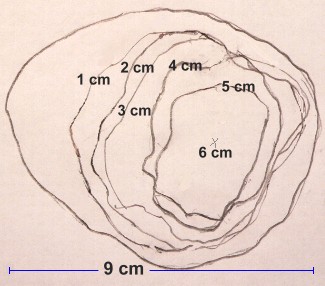
The map at the right is the finished topographic map of our mountain. We also added a scale.
What the Lines Tell You
 On our map, each line represents an increase in elevation of 1 cm. Have a look at the pictures above.
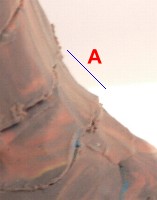
In the picture on the left, you can see an increase in height of 1 cm at a spot where the slope is quite shallow. The side of the mountain isn't very steep ... we labelled it 'A'. Because there is a fairly large horizontal distance covered as you move up the slope 1 cm, the distance between the lines on our map should be large; have a look at region 'A' on the map.
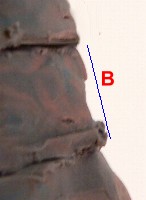
Now examine the picture at the far right. Here the slope is very steep; there is only a slight horizontal distance covered as you move up the mountain 1 cm. We labelled this region 'B', and you can see on the map that it is represented by two lines close together.
 In other words, on a topographic map, lines close together indicate a steep slope, while lines far apart indicate a gentle slope.
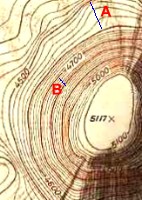
Examine the portion of a real topograhic map shown at the right, where the darker lines indicate an elevation change of 100 feet at a time.
Region 'A' shows a change in elevation from 4500 to 4600 feet, and represents a shallow slope, because the lines are far apart.
Region 'B' shows an elevation change from 4700 to 4800 feet, a much steeper part of the slope because the lines are closer together.
|
Resources
|