 Page Two 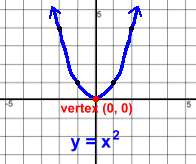 Remember that every quadratic function we graph will reflect changes made to the basic parabola y = +1x2 This simplest example opens upwards (+), has shape coefficient 1, and is not shifted, so its vertex remains at (0, 0). 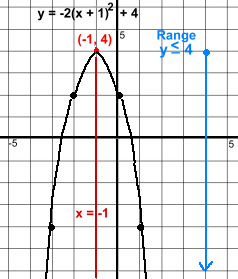
Example 2: y = -2(x + 1)2 + 4 This parabola will open downwards (-), and will be steeper than the simple one above (because of the 2). Its vertex will move left 1 and up 4, to become (-1, 4). The axis of symmetry will be x = -1. The domain will be x ε R (all parabolas have this domain). The range is y ≦ 4. Examine the graph to see why this makes sense: 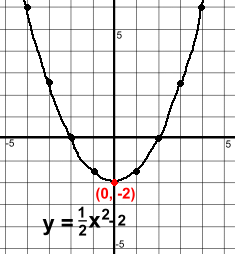 Example 3: y = ½x2 - 2
This opens upwards (½ is positive) and is less steep than y = 1x2 There is no bracket around the x, which means it's actually y = ½(x + 0)2 - 2, so there is no left or right shift The -2 indicates a shift down of 2 This makes the vertex (0, -2) The domain will be, as always, x ε R The range will be y ≧ -2 The axis of symmetry will be the vertical line x = 0 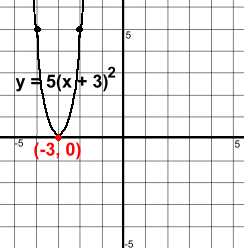 Example 4: y = 5(x + 3)2
This parabola also opens upward (5 is positive) and is much steeper than y = 1x2. There is a shift left of 3 With no number at the end, there is no shift up or down. Think of the equation as y = 5(x + 3)2 + 0 This results in the vertex moving left 3 only, to (-3, 0) Domain: x ε R Range: y ≧ 0 |