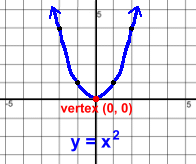
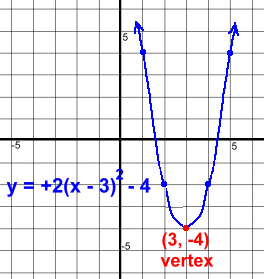
 A quadratic function is a polynomial equation where the highest power of x is 2. It might look like this: y = 2x2 - 6x + 1  Quadratic functions result in graphs that look like the one at the left. Quadratic functions result in graphs that look like the one at the left.The shape is called a parabola. It is a conic section, along with ellipses, circles and hyperbolas. This example is the simplest possible parabola; it has the equation y = x2 or y = 1x2 We're going to learn how to graph a quadratic function, and complete the square to find out important information about the graph. We'll start with the end result. A quadratic function, after you've 'completed the square' (more on that later) will look something like this: Each colour-coded element of the function means something, which we'll explain. First, the resulting graph will be a parabola, because it's quadratic (highest power is 2) where the sign of c is the opposite of what's in the equation bracket y ≧ d if the parabola opens up y ≦ d if the parabola opens down Consider the information above a reference guide. We'll explain everything with examples. example 1: y = +2(x - 3)2 - 4  The basic parabola is y = 1x2 with vertex (0, 0), at the top of the page
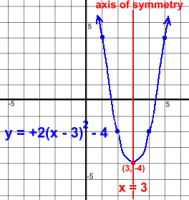
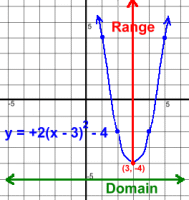
The +2 tells you that it opens up (+) and it's steeper than y = 1x2 The -3 with the x tells you it shifts the parabola right 3. This shift is opposite to the sign in the bracket The -4 at the end tells you it shifts the parabola down 4. This shift is NOT opposite to the sign With these two shifts, the vertex moves from (0, 0) to (3, -4) Here is more information about the graph:
|

