 The purpose of a science experiment, whether it is an assignment, a science fair project, or your job, is to answer a question. Here we will show you what happens after the question has been asked, by illustrating a complete science fair experiment. This is an actual experiment, done by two Worsley School students, and entered in the Regional Science Fair in Fairview, where it won first place in the Intermediate Physical Sciences division. The question: "Which home insulating material holds in the heat best?" Materials to be tested: 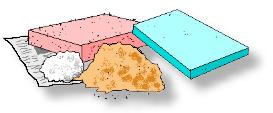 pink insulation pink insulationstyrofoam sawdust newspaper cotton The method: Build a box that will keep heat in. Heat it with a light bulb (A). Use a thermometer (B) to measure the drop in temperature. Line the box (C) with the different materials we want to test. Measure the temperature every 30 seconds. 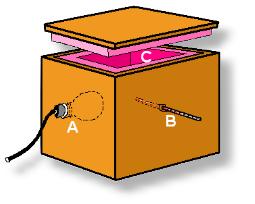
Procedure: The box is heated for 15 minutes using the lightbulb, before every test. The first step is to record the temperature drop for the box without any lining material. This provides a set of data against which we can compare various lining materials. Now line the box with one of the materials and record the temperature drop every 30 seconds. Repeat twice more, and average the results. Do this over again for each of the materials being tested. NOTE: The actual values obtained from this experiment no longer exist, so sample values will be used here. The temperature drop would probably be more gradual than illustrated.) 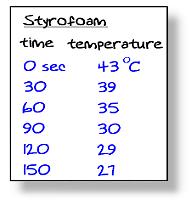 Here's a sample record in chart form for one test of styrofoam. There would have been two more of these, along with a fourth one showing the average of the three tests. This would have been repeated for each of the tested materials, as well as for the box with no added material (the control). All of the results would have been shown to the judges. After all the data has been collected, the results are recorded in a chart, and displayed in a graph: 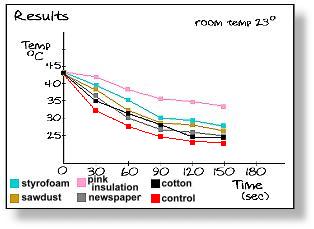 The results: The pink insulation retained heat best. Cotton was hardly better than no insulation. Discussion: Pink insulation is the standard insulating material for house construction. It is no surprise that it kept heat in better than the other materials. Styrofoam would probably perform better in thicker sheets; the thickness used here was much less than the pink insulation. Further research: What are the R.S.I. values for the materials used here, given their thickness? How do the sizes of these values compare to the relative insulating values determined by our experiment? Can the R.S.I. value for these materials be determined from our experimental setup? How closely do they match the actual values? (The students who did this experiment actually went on to calculate the R.S.I. value for pink insulation, by measuring the heat input of a 100kw bulb turned on for 15 minutes, and using a formula. Their value was within 20% of the rated value.) Visit my Science Fair section, which describes in complete detail how to choose and prepare a winning Science Fair project. |