 The graphs of some functions exhibit unusual behaviour, especially as values of x get larger and larger. Let's have a look at a simple function that has asymptotes.  The strange behaviour of this function and its graph comes from the fact that the variable x is in the denominator. The strange behaviour of this function and its graph comes from the fact that the variable x is in the denominator. When we start to fill in values for x, two things are going to happen:
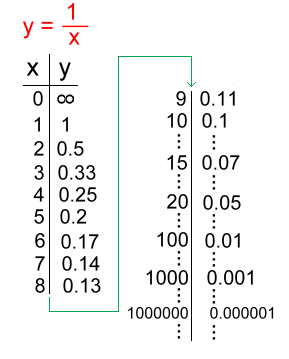 The value of x can of course be any real number, positive or negative. For the moment, let's look only what happens when x is positive and getting larger and larger. Have a look at the table of values on the right:
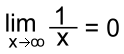
Here's the partial graph for positive x values only: 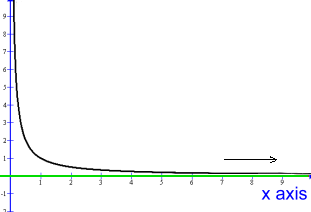 You can see the values of y getting smaller and smaller as x increases (direction of arrow); they are getting closer to zero, but will never get there.
 This type of behaviour is called asymptotic. The graph seems to be approaching the x axis (in red), which is the line with equation y = 0. The line y = 0, (in green) is called an asymptote. Looking again at the graph above you can see that the same behaviour seems to be happening close to x = 0. As x gets closer and closer to zero, from the right, the values of y are getting larger and larger. Since x can't be zero, the value there is also infinity. The y axis, or the vertical line x = 0, is also an asymptote. Remember that x can be any Real number, and both positive or negative. Let's return to the entire graph of y = 1/x. [You can see this on your Ti calculator:] 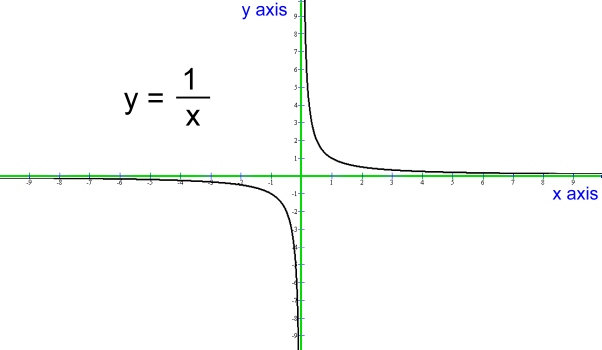 You can see that the full graph shows asymptotes in all four directions.
The x and y axes (in green), which are the lines y = 0 and x = 0, become the asymptotes. Here are the limit statements: 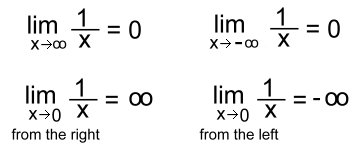
Asymptotes don't have to be the x and y axes: 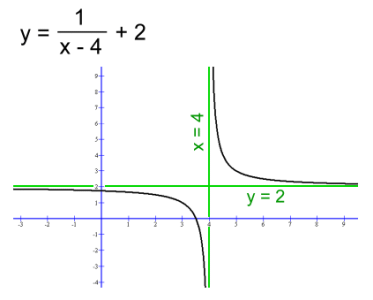
The asymptotes don't even have to be horizontal or vertical. Have a look at our page about the hyperbola. In three dimensions, the asymptotes would be planes; here's an example of a 3-dimensional graph with one asymptote plane (in green): 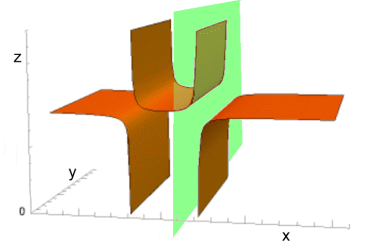 This topic is beyond the scope of high school mathematics, although the base 2D function y = cscθ is in Math 30. |
 Find out more about limits