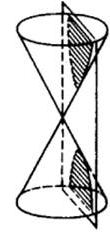
  The hyperbola is a conic section, along with ellipses, circles and parabolas. This topic is no longer in the Math 30 curriculum, but will be important in college engineering, math or physics courses. One way to get a hyperbola is to imagine a plane slicing through a double-napped cone. The slice must be steeper than that for a parabola, but does not have to be parallel to the cone's axis for the hyperbola to be symmetrical. The outline of the two cut faces on the cone forms a hyperbola. So a hyperbola is also a 'conic section', or section of a cone. Mathematically there are a number of ways to describe a hyperbola; we'll look at just a few of them here. We will ignore translations and rotations. 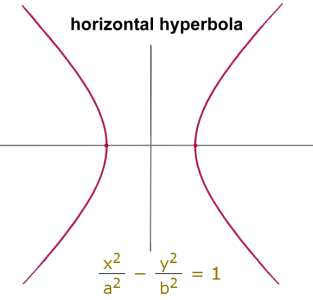 Here is the equation and graph for a horizontal hyperbola. 'Horizontal' means it opens left and right. Because there is no shift, the axis of symmetry is the x-axis, and it's centred on (0, 0).
Regardless of how the equation appears, when analyzing the graph the equation must be simplified to this form:  We'll look at what a and b represent later. Vertical hyperbolas have an axis of symmetry on the y axis, and open up and down. Their equation looks like this:  or reaaranged: or reaaranged:
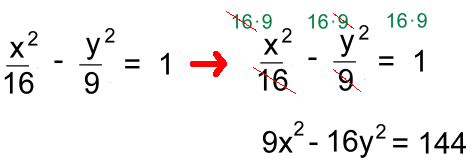
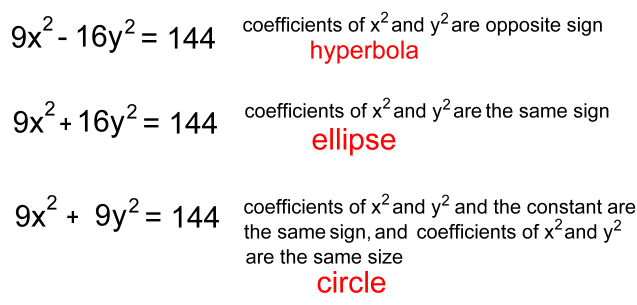
 In order to describe all the features of a hyperbola and it's graph, we'll pick an actual example: 
 Before returning to our example, let's look at some more features
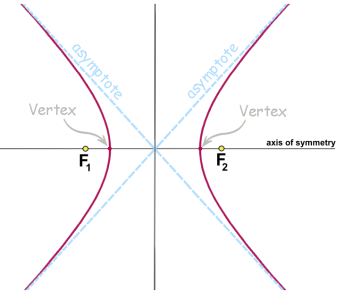
of a hyperbola. Like ellipses, hyperbolas have two foci, here labelled F1 and F2. They help describe the locus of points on the curve. The curve approaches two asymptotes on either side. We'll show you how to determine these below. Here is the example we're using:  a = 4 and b = 3 Sketching the hyperbola: Because this is a horizontal hyperbola, as discussed earlier, the value of a = 4 becomes half the transverse axis of the hyperbola, or half the distance between the verticies: 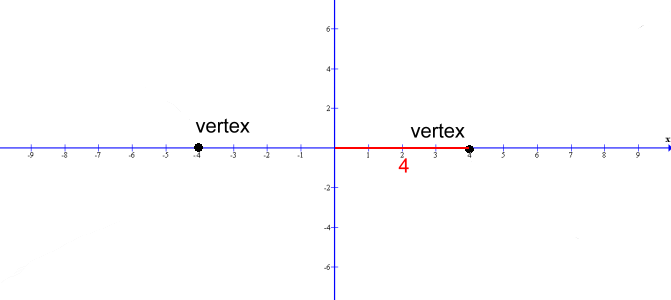 The values of a = 4 and b = 3 become the half-width and half-height of a rectangle centred at (0,0) 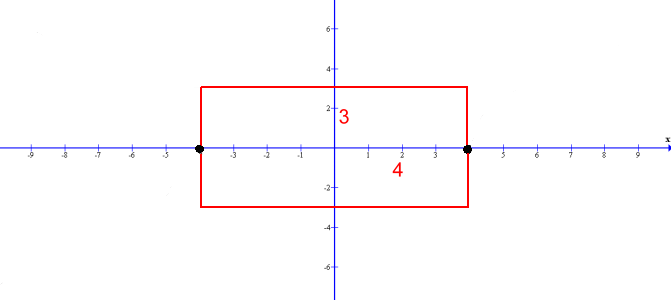 Draw the rectangle. Then join the corners with diagonal lines. These are the asymptotes 1 and 2 of the hyperbola, which you can now sketch. 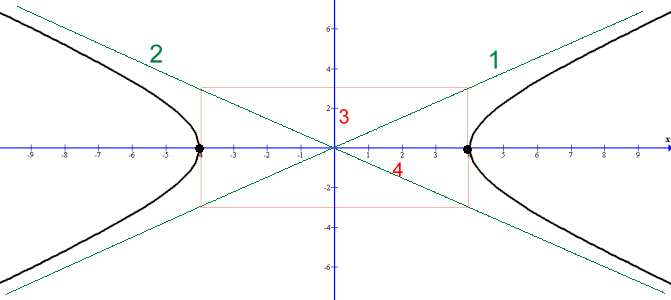 The equations of the two lines which form the asymptotes are: 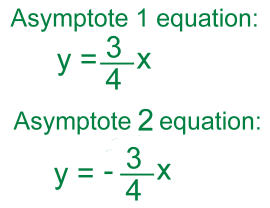 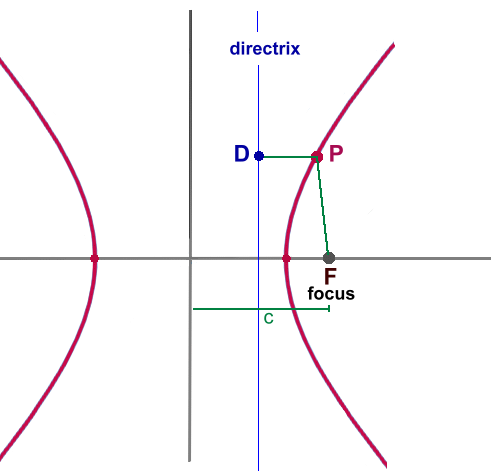
Another way to define a hyperbola involves one focus and directrix. c is the distance to the focus. The directrix is a vertical line on the other side of the vertex, with the equation:  (+ or - depending on which side of centre you're on) Points P on the hyperbola are defined as all the points (the 'locus') where the distance from P to the focus F, divided by the distance from P to a point D directly across on the directrix, is always the same. For a hyperbola, this ratio, called the eccentricity, is always greater than 1. 
Incidentally, hyperbolas can be graphed using your TI83/84 calculator. All that is necessary is to solve for Y first. We've shown that below, beginning with the simplified version of the equation. 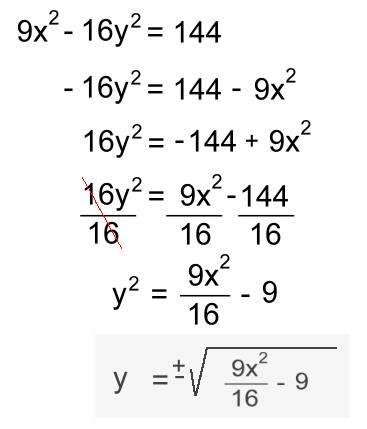 Entering the positive expression and the negative expression separately on your calculator with result in the portions of the graph above and below the x-axis being graphed on the same grid. Try it! Orbital Mechanics and Hyperbolic Orbits 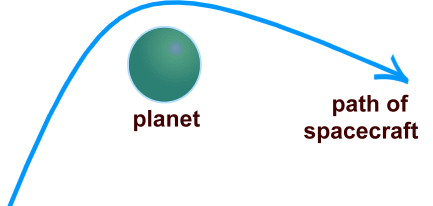 The 'orbit' of a spacecraft can sometimes be a hyperbola, if the speed of the spacecraft is greater than the escape velocity for the planet. This fact is also useful when sending a spacecraft to visit a distant body.
The craft can be sent close to an intermediary planet, where it will use the gravity of that planet to alter its path and propel it at high speed away from that planet and back out into space in a different direction, using a technique called a 'gravitational slingshot'. Voyager 2 used this technique and the gravitational attraction of Jupiter and Saturn to be propelled outwards to visit Uranus and Neptune. |
