 Sine θ, cosine θ and tangent θ, abbreviated as sin θ, cos θ and tan θ, are the three basic trigonometry ratios, introduced in Math 10. Below are the graphs of these functions, where θ is measured in degrees. On the y-axis, the value of the function at each given angle is plotted. These graphs, first introduced in Math 30, are used in many areas of engineering and science, including computing, navigation, mechanics, medical imaging, and measuring the heights of buildings and mountains, as well as many other fields. 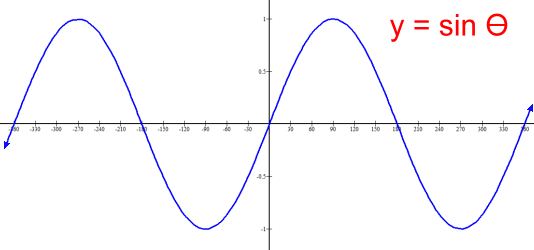 The graph shows that the function y = sin θ is infinite in length in both directions. Its height ranges between a minimum of -1 and a maximum of 1; its range is -1 ≤ y ≤ 1. The amplitude, defined as the height of the graph above its center line (here the x axis) is 1. Notice that the graph is cyclic; the segment from θ = 0° to θ = 360° represents the period of the graph, and repeats over and over, forwards and backwards. 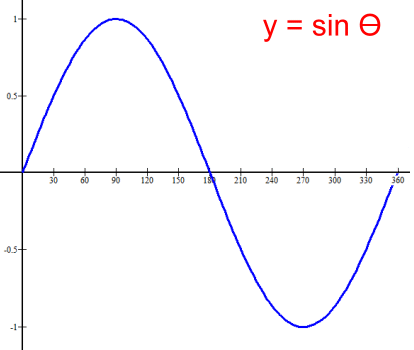
Here is a single period of the graph of Period: 360° Amplitude: 1 Maximum: 1 Minimum -1 Range: -1 ≤ y ≤ 1 The key values: sin 0° = 0 sin 90° = 1 sin 180° = 0 sin 270° = -1 sin 360° = 0 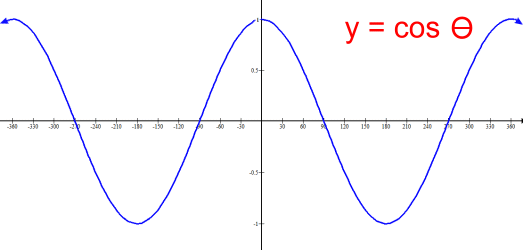 The graph shows that the function y = cos θ is infinite in length in both directions. Its height ranges between a minimum of -1 and a maximum of 1; its range is -1 ≤ y ≤ 1. The amplitude, defined as the height of the graph above its center line (here the x axis) is 1. Notice that the graph is cyclic; the segment from θ = 0° to θ = 360° represents the period of the graph, and repeats over and over, forwards and backwards. The cosine graph is identical to a sine graph which has been shifted 90° left. 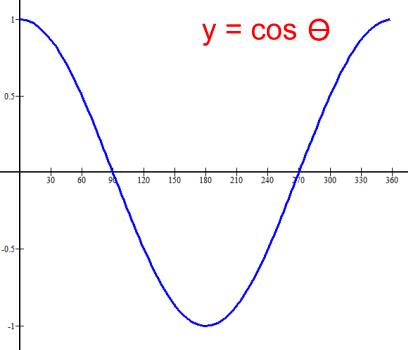 Here is a single period of the graph of
 Period: 360° Amplitude: 1 Maximum: 1 Minimum -1 Range: -1 ≤ y ≤ 1 The key values: cos 0° = 1 cos 90° = 0 cos 180° = -1 cos 270° = 0 cos 360° = 1 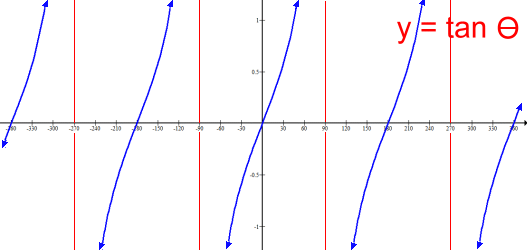 The graph shows that the function y = tan θ is infinite in length in both directions. Its height is also infinite, so there is no amplitude, no max or min, and the range is y ε R. Notice that the graph is cyclic; the segment from θ = 0° to θ = 180° represents the period of the graph, and repeats over and over, forwards and backwards. The red lines represent asymptotes, where the graph approaches infinity or negative infinity. This makes the graph of y = tan θ discontinuous. Asymptotes are at 90° and every 180° forwards and backwards from there. 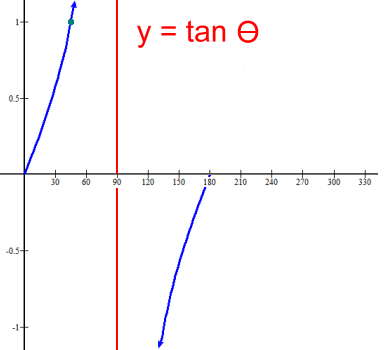
Here is a single period of the graph of Period: 180° Amplitude: none Maximum: none Minimum none Asymptote at θ = 90° The key values: tan 0° = 0 tan 45° = 1 (green dot) tan 180° = 0 The three basic graphs above should be committed to memory, as they are used extensively in the trigonometry unit of Math 30. The three reciprocal functions, cosecant (csc θ), secant (sec θ), and cotangent (cot θ), are also studied in Math 30, but are used less often. |