 The domain of a function is the set of x values that we are allowed to use when evaluating the function. The range of the function is the set of y values that the function produces. Most functions covered in high school mathematics have a domain and range drawn from the set of Real numbers. This will result in a graph that is made from an infinite sequence of points (represented by a solid line or curve) that may also extend to infinity in one or more directions (represented with arrows). While most functions allow you to choose any Real number for x, with a few exceptions, in many cases the range of y values will be restricted to only certain Real numbers. This give rise to the many shapes of function graphs we see. This page is designed to show how to find the domain and range of any relation, including functions, given its graph. We'll include lots of examples.  Our first example is a line. We chose the simplest oblique line, with equation y = x.
 When plotting the graph, we can choose any Real number for x. We say that the domain is any Real number. In symbols this is written: Domain: x ε R. This translates as 'x is an element of the set of Real numbers'. The function returns all the Real values for y, so the range is written as y ε R. No matter how far left or right you look for x, there will always be a y value. The line extends to infinity in all directions. 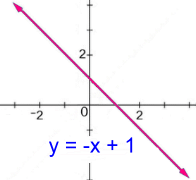
Domain and range will be the same for all oblique lines, regardless of their slope or orientation. Domain: x ε R Range: y ε R 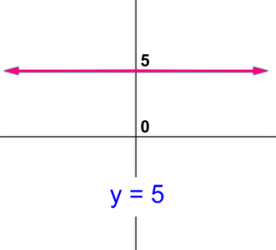 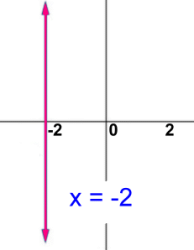 A non-oblique line is horizontal or vertical.
The horizontal line y = 5 on the left will let you choose any x value, so the domain will be x ε R. However, all the points on this line have y value 5, so the range is y = 5. The vertical line at the right is different. Here all the points have x value -2, so the domain is x = -2. The y values are all Real numbers up and down, so the range is y ε R. 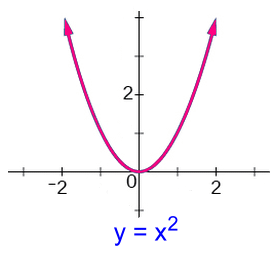
This is the simplest quadratic function, with its vertex (0, 0) being the lowest point. All points on the graph have x and y values which are equal to or bigger than zero. Domain: x ε R, x ≥ 0 Range: y ε R, y ≥ 0 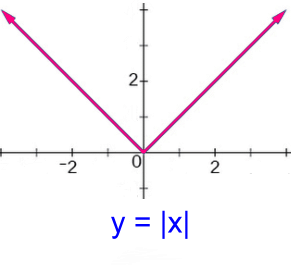 On the left is the simplest absolute value graph.
 Any x value can be chosen, since the graph continues forever left and right. This means the domain is x ε R. The graph is made from an infinite number of Real numbers as well, so the range is y ε R. However, the graph's y values are restricted to those from 0 and up. This makes the range y ≥ 0, y ε R Often we'll assume the use of Real numbers, and will state the range as simply y ≥ 0. We won't do that here. 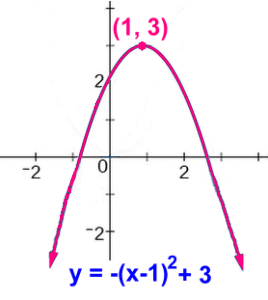 Here's an example of another quadratic function whose equation is
 The graph runs forever left and right, so the domain is x ε R. The range is all real numbers, but the graph is made up from only the y value 3 and downwards. This makes the range y ≤ 3. Written in full: Domain: x ε R Range: y ε R, y ≤ 3. 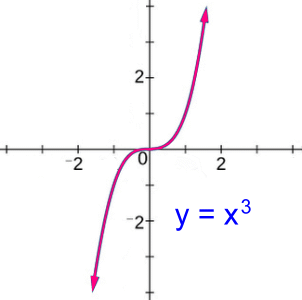 This is the cubic function y = x3.
It is similar to a line, in that it extends to negative and positive infinity in both direstions. Domain: x ε R Range: y ε R This will be the domain and range for all odd powered polynomial functions. 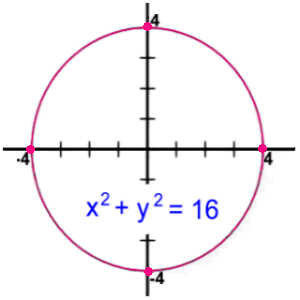 This circle graph has the equation x2 + y2 = 16.
 It has radius 4. The graph extends to 4 in all directions. This means that there are no points on this graph with x values bigger in size than 4, or y values bigger in size than 4. Saying this differently, the values for x and y are always less than or equal to 4. This is not a function, but we can still find domain & range. Domain: x ε R, -4 ≤ x ≤ 4 Range: y ε R, -4 ≤ y ≤ 4 (Notice the use of the 'between' notation from Math 9) 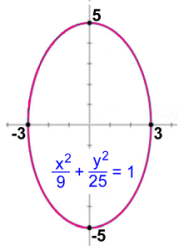
Here's an ellipse, which works almost the same way as a circle, except that the dimensions are different in each direction. No x values are bigger in size than 3 No y values are bigger in size than 5 Domain: x ε R, -3 ≤ x ≤ 3 Range: y ε R, -5 ≤ y ≤ 5 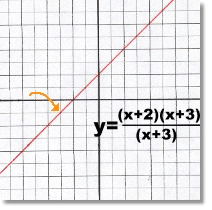 This is a discontinuous function. It looks like a line, but you can see from its equation that x= -3 is an undefined value, as it would mean dividing by zero if it is used.
The graph actually has a hole at -3. The corresponding y value of -1 isn't on the line either. Domain: x ε R, x ≠ -3 Range: y ε R, y ≠ -1 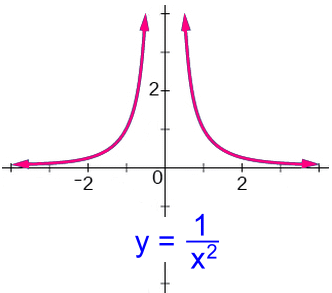
This function is also discontinuous. It has two asymptotes. The value of x cannot be zero; it's an undefined value as explained above. The y axis is an asymptote. You can't get zero or a negative number for an answer for y by substituting any possible value of x, so the graph is above zero. The x axis is an asymptote. Domain: x ε R, x ≠ 0 Range: y ε R, y > 0 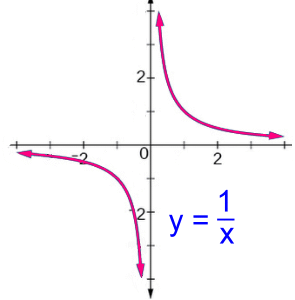
Here's another discontinuous function. You can't fill x into the equation because it would mean dividing by zero, so there is no value there. Also, there is no value you can fill in for x that would result in y being zero. It has two asymptotes, one the vertical line x = 0 and the other the horizontal line y = 0. Domain: x ε R, x ≠ 0 Range: y ε R, y ≠ 0 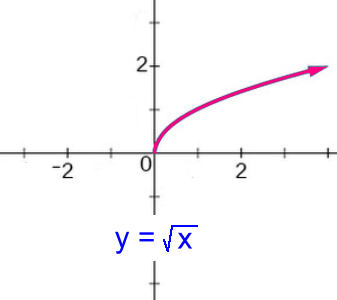
The starting point is (0, 0). In this function, there are no negative x's or y's. Both x and y must be bigger than or equal to zero. Domain: x ε R, x ≥ 0 Range: y ε R, y ≥ 0 Can you picture what the domain and range would be if the starting point were (2, 4)? Find out by holding the cursor over the grey box 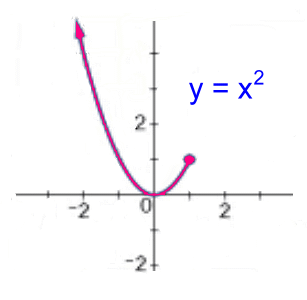
Here's a simple parabola again, but there's part of it missing. The dot is solid, which means that point is on the graph. All of the x values are less than that point at x = 1. As with a full parabola with vertex (0, 0), the y values are all equal to or greater than zero. Domain: x ε R, x ≤ 1 Range: y ε R, y ≥ 0 |