|
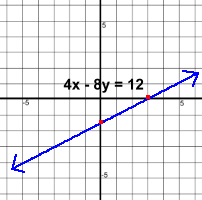
Here are three quick ways to plot the graph of a linear rule or equation. Method 1: Find the Intercepts This method is quick because the two points we're looking for have zeroes in them, so they're easy to solve for. Equations containing both variables x and y will result in an oblique line. 4x - 8y = 12
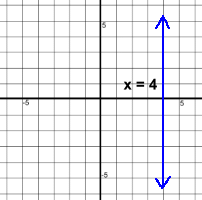
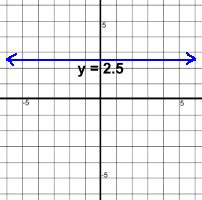
 Method 2: Horizontal or Vertical Lines
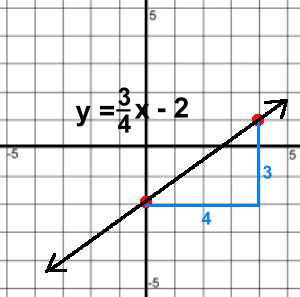
Method 3: Slope-Y Intercept Method Before we show you this method, there are some more facts about lines that you need to know. Learn about slopes and y intercepts here. Then come back. If you know the equation of a line, and it's in 'y =' form, you can graph the line very quickly without making a table of points. Let's look at the example y = 3x - 4 
You've just learned that the slope of this line is 3, and the y intercept is (0, -4). That gives us a starting point, (0, -4). Locate that point on the graph. The slope is 3. Make this into a fraction '3 over 1' so you have a 'rise over run'. Start at (0, -4). Run 1 and rise 3. This will take you to another point on the line (1, -1). Draw the line through (0, -4) and (1, -1), and there's your graph! Here's another one: y = ¾ x - 2
Linear Equations | Parallel and Perpendicular | Equation Forms | Finding Equations |
 This equation has just x's, so it must be a vertical line.
 This equation has just y's, so it's a horizontal line.