|
The idea that position could be identified by ordered pairs of numbers on a set of crossed number lines is thought to have been 'discovered' by Rene Descartes in the early 1600's. Apparently he thought of it while watching a fly crawl around on ceiling tiles. Locating points this way makes algebraic descriptions of slopes and lines possible, and opens up the world of algebraic functions. Let's start by defining the slope of a line on a cartesian graph. To do that, we'll first graph a simple set of points that form a line. Points (x, y) are generated using a rule; we'll use y = 2x - 3. We'll pick a few x values, and work out the corresponding y value for each using the rule. For example, if x were 2, the matching y value would be 2·2 - 3 which is 1. The ordered pair we'd plot would be (2, 1). Here is a table of points we worked out, and we've also plotted them. 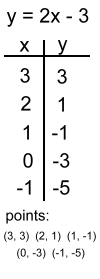 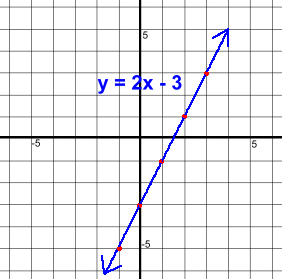 Reminders:
Now lets redefine slope using the above example. 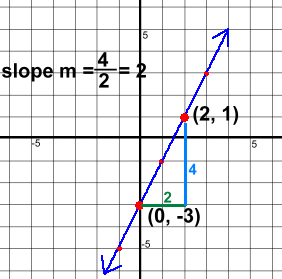 We picked two of the points, (0, -3) and (2, 1) and marked the run and rise to get from the first to the second point. Then we worked out the slope using 'rise over run' and got a slope of 2.
Here's a quicker way. The points were (0, -3) and (2, 1) The x coordinates changed by 2. Subtracting: 2 - 0 = 2 Call this Δx The y coordinates changed by 4. Subtracting: 1 - -3 = 4 Call this Δy So instead of rise over run, slope can be defined as Δy over Δx Δ means 'subtract' or 'change in'. It's pronounced 'delta'. The reason for redefining slope this way is that now we don't need a graph to find the slope of a line between any two points! Using points (0, -3) and (2, 1) again: m = Δy over Δx = (1- -3) over (2 - 0) = 4 over 2 = 2 all without a graph! It doesn't matter which way you subtract, as long as you subtract the y's and the x's in the same direction. Let's practice a few more. 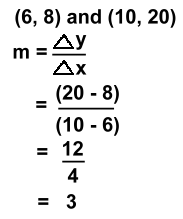
We subtracted right to left. Notice that the y's are on top, corresponding to the 'rise'. The slope is 'delta y over delta x'. These two points lie along a line with slope 3. This line wold be steeper than the example above. 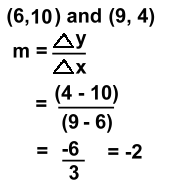
These two points lie on a line with slope -2. This line would slope downwards. It's not as steep as the line above. 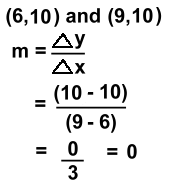
These two points are on a line with slope 0. This is a horizontal line. How could you tell, by looking at the points? 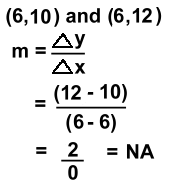
These points lie on a line with no slope. This must be a vertical line. How could you tell, by looking at the points? Linear Equations | Parallel and Perpendicular | Equation Forms | Finding Equations |