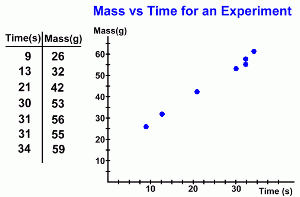
 Finding the Equation of the Line This page will show you how to find the equation of the line of best fit. First we'll do the calculations on paper, using the point-slope formula. Then we'll show you how to make your TI83+ calculator do all the work!  Here is the sample scatter plot we will use.
 It represents data collected in an experiment, where we measured the mass of a solid that formed in a beaker after leaving it for a specified time. Each data point represents the mass of one sample (in grams) and the time it took to form (in seconds). The data generate a very strong positive correlation. In order to predict how much mass will be present after 250 seconds, we will draw the line of best fit and find its equation. Method 1: Using the Point-Slope Formula 
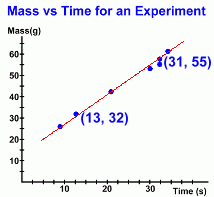
At the right you can see the line drawn. We did this by 'eye', so our calculations below will only be approximations. We've also identified two points; the points used must be on the actual line. First we'll use those points to find the slope m of the line: 
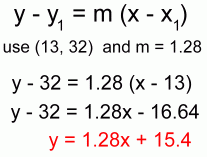
Then we'll use the point-slope equation to find the line's equation: 
Using the variables from the problem, the equation is: mass = 1.28 x time + 15.4 or M = 1.28·t + 15.4 We can now use this equation to predict the mass after 250 seconds: M = 1.28(250) + 15.4 = 335.4 grams . Remember: because there is some variability in where to locate the line of best fit, the equation for that line is only an approximation. This will always be true when the correlation is anything but perfect (ie: the points don't line up perfectly). However the equation does describe the direction of the points on the graph, and is useful for making predictions like the example above. |