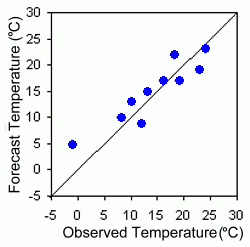
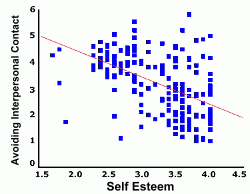
 Page Four Here are some actual examples of scatter plots being used.
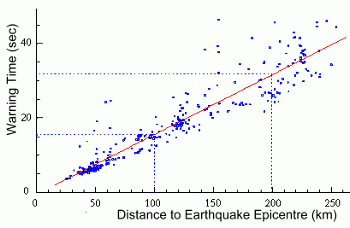
 This is a graph made by scientists monitoring earthquakes. You can see that there are hundreds of data points, each one representing an earthquake that occurred somewhere.
 When an earthquake takes place somewhere, the first indication is the arrival of the fast-moving, relatively harmless p-waves; this is followed by the slower moving s-waves, which can cause the ground to move up and down violently. The time between the first p-waves arriving and the beginning of maximum ground shaking is called the warning time. Each point on this graph represents the warning time and the distance to a specific earthquake. You can see a strong positive correlation, which indicates that the further away an earthquake is, the longer the warning time. (In other words, when a distant earthquake occurs, there will be a longer time between the arrival of the first p-waves and the more destructive s-waves). For example, at a distance of 100 km, there is approximately 16 seconds of warning time between the earthquake onset and the arrival of the destructive s-waves. For an earthquake 200 km away, the warning time increases to about 32 seconds. |

