 
Introduction We're going to explain how to analyze a cubic function algebraically to find the x and y intercepts, and the behaviour at very small and very large values of x (the end behaviours), and we'll show and describe the resulting graph. A cubic function is continuous function, and can have three Real x intercepts, or one Real and two imaginary x intercepts. Because it's an odd function (its highest power is an odd number) it must cross the x axis to get from negative infinity to positive infinity (or vice versa), so there must be at least one x intercept. Similarly, its domain is x ε R, so it must cross the y axis. 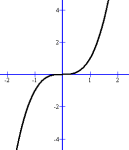 The characteristic shape of a cubic function graph is sort of a flipped 'S'.
 A key attribute is that the direction it curves will change at some point; here that happens at (0, 0). But the graph can also curve down and up again more dramatically, as we'll see in the first example below. Here's an example of a more general cubic function. We'll describe and find its attributes. y = x3 - 3x2 - 10x + 24 In this form, the function tells us only that the y intercept (when x is 0) will be +24. (You did this with linear functions in grade 10 math). In order to find the x intercepts, we will have to factor the polynomial equation, just as you did for quadratic functions in grade 11 math. However, you have never learned how to factor a general cubic function until now. We'll show you that too. The end result will look like this: y = x3 - 3x2 - 10x + 24 y = (x - 2)(x + 3)(x - 4) after factoring so that the x intercepts when y = 0: 0 = (x - 2)(x + 3)(x - 4) are 2, -3, and 4 When you fill in a very large value of x into y = x3 - 3x2 - 10x + 24, the x3 term becomes very much larger than the rest of the expression, so the resulting y value will also be very large. Because x is cubed, the large value will share the sign of the large x. Saying this mathematically: As x approaches +∞, y also approaches +∞ Alternatively, as x approaches -∞, y also approaches -∞ So the graph goes up to the right, and down to the left. Here are the table and graph that summarize all the information we have. It's generaly not necessary to find any more points than these. 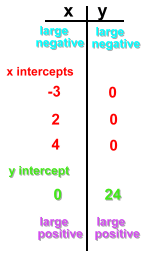 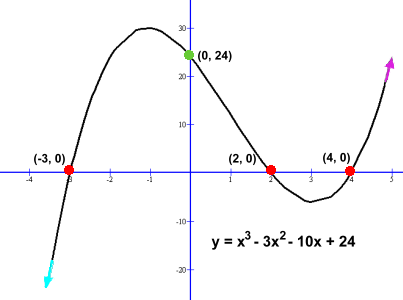 In Math 30 you aren't required to identify the local maximum and minimum values where the graph loops, although you can easily find them on a graphing calculator. This means your graph won't be very accurate where you sketch in the loops. You can use a graphing calculator to help if you want, but that isn't really necessary. In Math 31 (calculus) you will discover that you can use the first derivative of the function to find the two places where the slope is zero. Now let's look at examples that illustrate all the things that can happen with cubic functions. We'll dispense with the colour coding and some of the explanations, but will include a review of the algebra needed to find the x intercepts. This will by no means be a complete explanation of all possible cubic functions; we're just going to examine some of the basic ones you're most likely to see in Math 30. |